INPUT
SNP ID
Enter the ID of the SNP of interest (e.g. a significant SNP from a GWAS) that you want to compare with other SNPs.Population
Choose the population (e.g. Central European).Region around SNP of interest
Choose the initial-region for which LD should be calculated. Default is 300 kb around start-SNP.LD
Decide which measure should be used to define LD (Linkage Disequilibrium) region. (You can chose between D' and r².)Threshold
The program is looking for the most distant SNPs whose LD is above the chosen threshold. These two SNPs define the LD region. Default is 0.2Plot format
Choose the format of the plot file. (PDF is always additionally generated.)Color of SNPs
You can assign a colour to each SNP class. If an SNP belongs to several classes it is assigned the color of the highest class to which it belongsShow genes
If you check the box the genes are shown as brown arrows in the plot.
OUTPUT
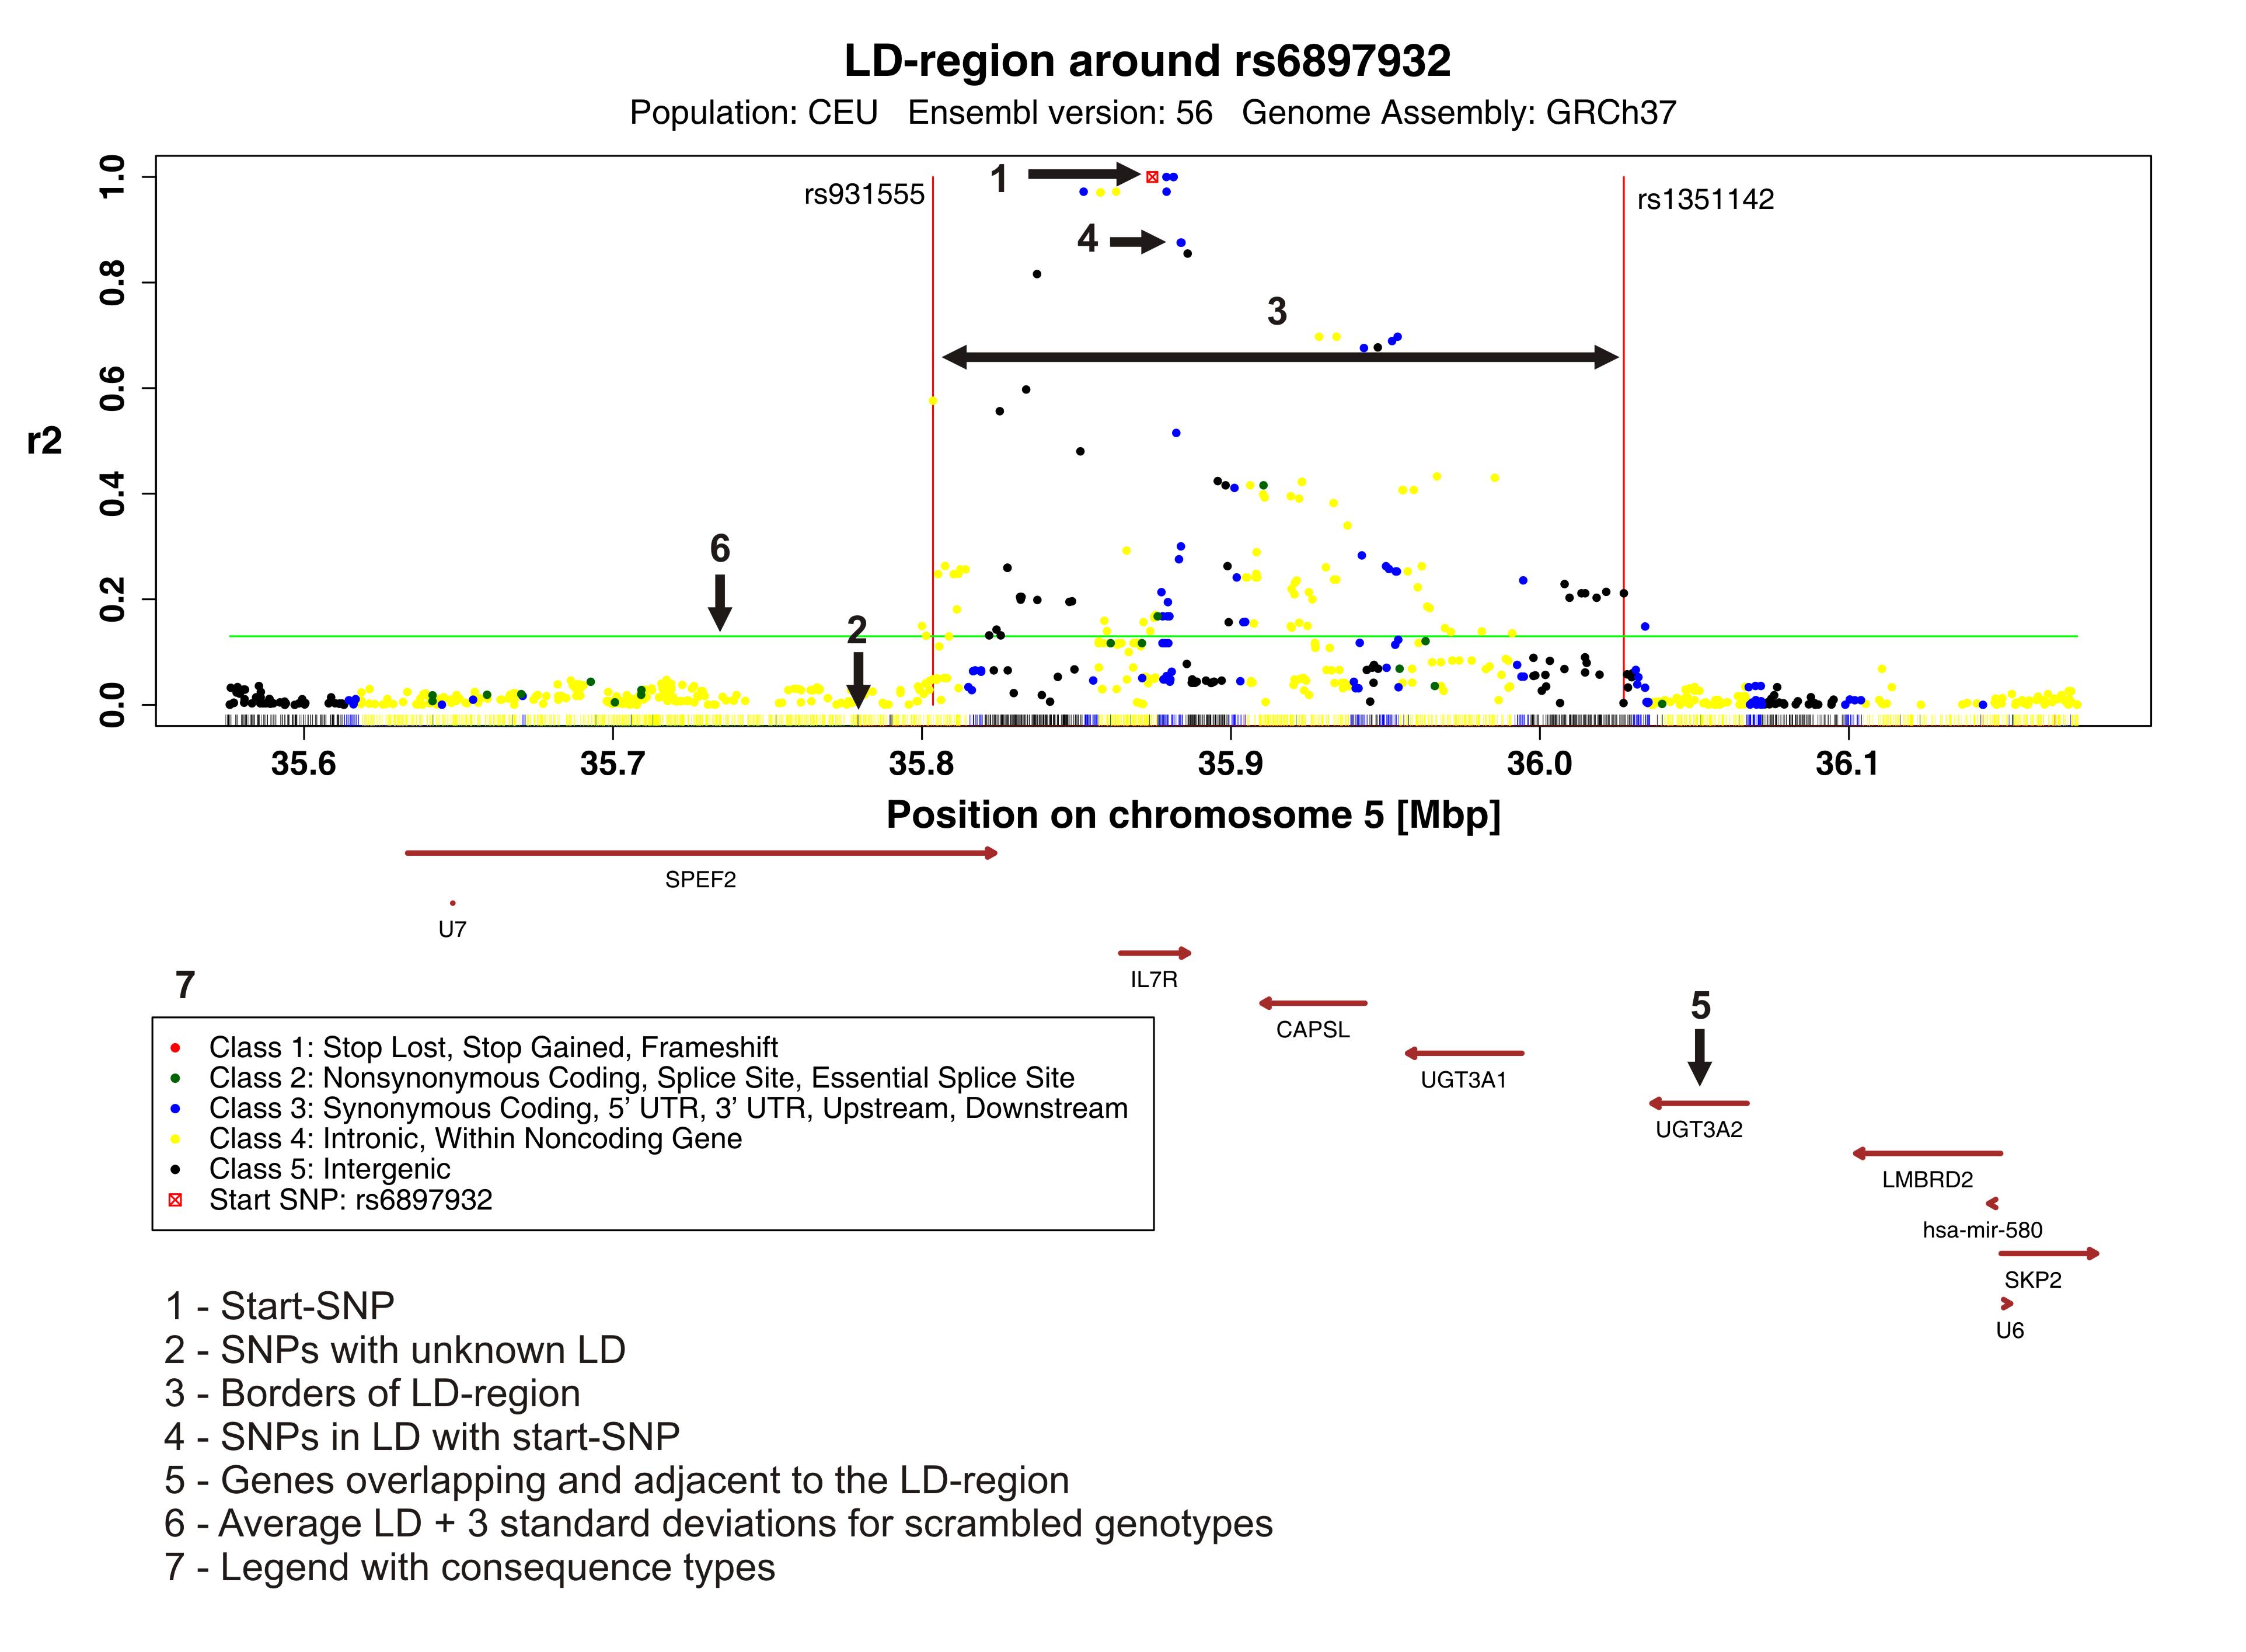
Imagefile
- The red cross is the start-SNP you have chosen (1).
- The data points in the plot represent the LD values of SNPs (4). The color represents the functional class as specified in the input.
- The ticks represent the SNPs with unknown LD (2). The color represents the functional class as specified in the input.
- The two red lines define the LD region (3).
- The horizontal green line shows the average LD plus three standard deviations for scrambled genotypes (6).
- The horizontal brown arrows represent the genes (5).
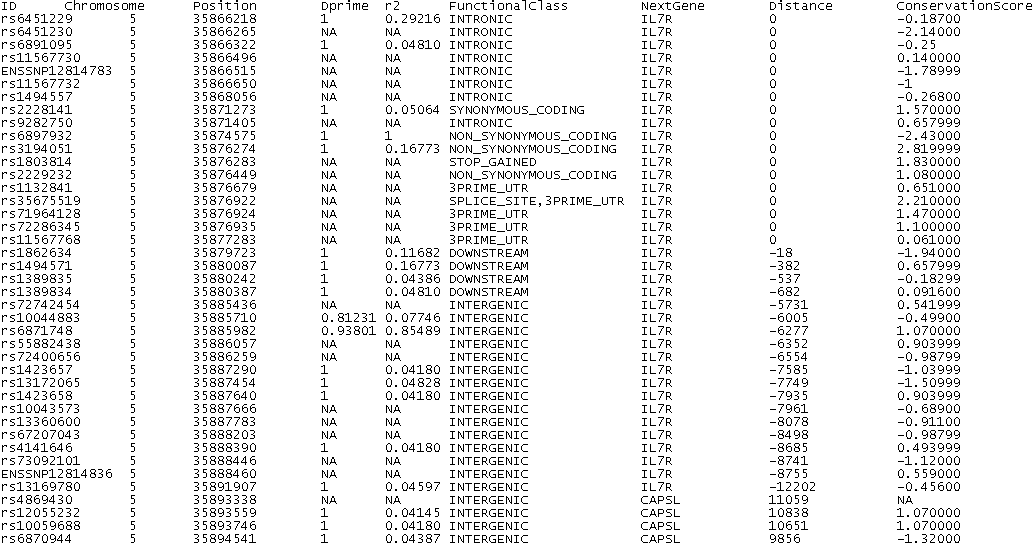
Textfile
The textfile lists annotation about all SNPs in the LD region with the following columns:
- ID of the SNP
- Chromosome
- Chromosomal position
- D' (only available for HapMap-SNPs)
- r² (only available for HapMap-SNPs)
- Functional class
- Nearest gene
- Distance to nearest gene
- Conservation score (not for all SNPs)
FUNCTIONAL CLASS
A short description of the different functional classes of SNPs used by CandiSNPer:
Name of functional class Description Stop Lost causes a loss of a stop codon Stop Gained causes a gain of a stop codon Frameshift Coding An insertion or a deletion in the coding region which causes a frameshift Non-Synonymous Coding A change of a nucleic acid in the coding region, which causes a change of the amino acid Synonymous Coding A change of a nucleic acid in the coding region, which doeas not causes a change of the amino acid Intronic change in intron Splice Site change 1-3 bps into an exon or 3-8 bps into an intron Essential Splice Site in the first 2 or the last 2 base pairs of an intron 5'UTR change in transcript, upstream of the coding region 3'UTR change in transcript, downstream of the coding region Upstream Within 5000 bps upstream of the gene, [with respect to the strand of the gene] Downstream Within 5000 bps downstream of the gene [with respect to the strand of the gene] Intergenic change outside a gene and the distance to the next gene is greater than 5000 bps Within non-coding gene change in a non-coding gene
Citation
Schmitt, AO, Assmus J, Bortfeldt, RH, and Brockmann, GA
CandiSNPer: a web tool for the identification of candidate SNPs for causal variants.
Bioinformatics 26 (7) 2009. PubMed