
EEG Lab Photosensor
Testing monitor/trigger accuracy with Biosemi photosensor

Why should you do this?
You want to make sure, that what the subjects sees is exactly what you intended. Especially in EEG experiments timing is crucial, so make sure that:
- stimulus presentation is synchronized to the vertical refresh of the CRT monitor
- stimulus timing is accurate even for very short stimulus presentation
- triggers indicating stimulus onsets are sent with accurate timing
How does it work?
We can test timing accuracy using Biosemi's optical sensor. This sensor is a photodiode which you attach to the monitor to directly measure what is presented there. The basic idea is to present test stimuli on the CRT monitor, send triggers to the EEG amplifier indicating stimulus presentation and recording stimulus onsets directly with the optical sensor. We will then compare the signal recorded by the sensor (read: what really happened on the screen) with what Psychtoolbox and the EEG triggers claim what happened.
What do you need to do?
Files: You find the example files on Stim 2: “C:\Computer info\matlab\photoDiode”
Setup
Hardware
- Attach the optical sensor to the monitor (use tape as shown in top left picture). The sensor needs to be where the stimulus appears, as its receptive field is quite small.
- Plug the other end of the cable into the Ergo 1 socket of the amplifier (see top right). You will need no other leads (active electrodes, CMS/DRL) this time.
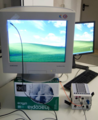
Attach the photodiode
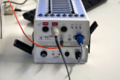
Plug the other end of the cable into “Ergo1” on the amplifier to the monitor


Software
Acquisition Computer
- Start ActiView and load the OpticalSensor.cfg configuration file
- Click on the "auxiliary sensors" tab and make sure you see the optical sensor's signal.
- Click on "start file", select “Add Displayed Sensors”. This is critical, otherwise the data from your sensor will not be recorded!
Stimulus Computer
- Load the script of your experiment; which you adapted, such that
- a strongly visible (high contrast, eg. a big white star on black background) stimulus is always presented at the same location (where you attach the sensor to the screen)
- it sends triggers to the EEG amplifier indicating which stimulus is sent when (for example 1 = onset condition 1, 2 = onset condition 2, …), and when the stimulus sets off
- an example script is "stimulateSensor.m". It requires access to Psychtoolbox and the SendTrigger.m function.
- Run the script
Analysis
Look at the results (on any computer).
- Run the script "sensorAnalysis.m" in matlab; again you might need to adapt it (e.g. by entering your trigger-numbers)
- A figure will pop up like the ones below.

What you want to check
- All the traces in the upper panel have to be perfectly aligned. Specifically, you do not want to see any flat traces. This would indicate that the stimulus was not presented at all. Also, traces should rise and fall at exactly the same time. Otherwise, stimulus onset/offset was too early/late on some trials.
- The duration of the signal must match the desired duration as set in the Psychtoolbox script.
- The onset of the signal should coincide closely with the trigger, i.e. at time zero.
Stim2 Analysis - Dec 2017 - Jan 2018
The above procedure was conducted in MATLAB on Sim2. A full description of the experiment and procedure is available upon request. The conclusion from this experiment is that there is a constant delay of about 10-11ms when presenting simple stimuli on the CRT monitor in the EEG Lab. Furthermore, there appears to be phase-locking on the monitor, which may correspond to the Vertical Blank Interval. A special wiki talk page has been established to discuss this topic here. These conclusions can be seen in the plots below.
Average Sensor Signal at line before Screen('Flip');
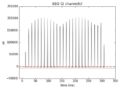
Fig. 1. Average Signal Before Screen('Flip');
Fig. 2. Average Signal Before Screen('Flip');
Fig. 3. PSD Before Screen('Flip');

Average Sensor Signal at line after Screen('Flip');
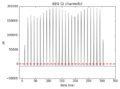
Fig. 4. Average Signal After Screen('Flip');
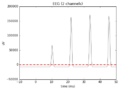
Fig. 5. Average Signal After Screen('Flip');
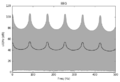
Fig. 6. PSD Before Screen('Flip');


In conclusion, the delay appears to be constant (not jitter), which is good. However, each script will differ in the amount of computational load placed on the stimulus computer. Experimenters in the EEG lab should check the timing of their triggers and stimulus onsets in their own experimental scripts using the photodiode.