
Nikon TIRF microscope
Single-molecule and dual-colour imaging of cells in microfluidic chips.
Interactive 3D view (external link to lumalabs.ai)
The lab is located in the Rhoda-Erdmann-Haus on Campus Nord of Humboldt-Universität zu Berlin.
 GitHubPublicCode and scripts of our publications, for example for the analysis of mother-machine experiments and of flagellar structures.Browse the repositories github.com/SalmoLab
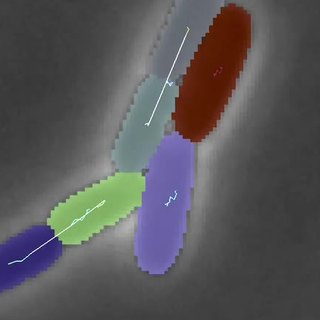 Image analysisPublicSoftware for the segmentation, tracking and quantification of bacteria in mother-machine and time-lapse data.Image analysis tools Tools, pipelines and code
 Motility simulationInteractiveSingle-cell swimming of strains with different numbers of flagella, in liquid and in agarose (Giralt-Zúñiga et al. 2026).Start the simulation Runs in the browser
 Lab membersThe internal database, wiki and electronic lab notebook of the lab.Log in bactobase.biologie.hu-berlin.de
Single-molecule and dual-colour imaging of cells in microfluidic chips.
Interactive 3D view (external link to lumalabs.ai)
Time-lapse imaging of growing cells with two cameras.
Interactive 3D view (external link to lumalabs.ai)
Super-resolution imaging below the diffraction limit.
Interactive 3D view (external link to lumalabs.ai)
3D captures by Mario Delgadillo-Guevara.
We combine bacterial genetics, quantitative single-cell microscopy and microfluidics with biochemistry, infection experiments, image analysis and modelling.
In the mother machine, single bacteria grow in narrow channels of a microfluidic chip while fresh medium flows past the open ends of the channels. We follow growth, division and gene expression of thousands of single cells over many generations, for example the expression of the flagellar genes.
In microfluidic chambers we also follow bacterial communities, for example the transfer of plasmids between cells.
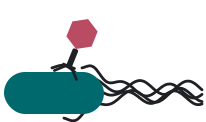
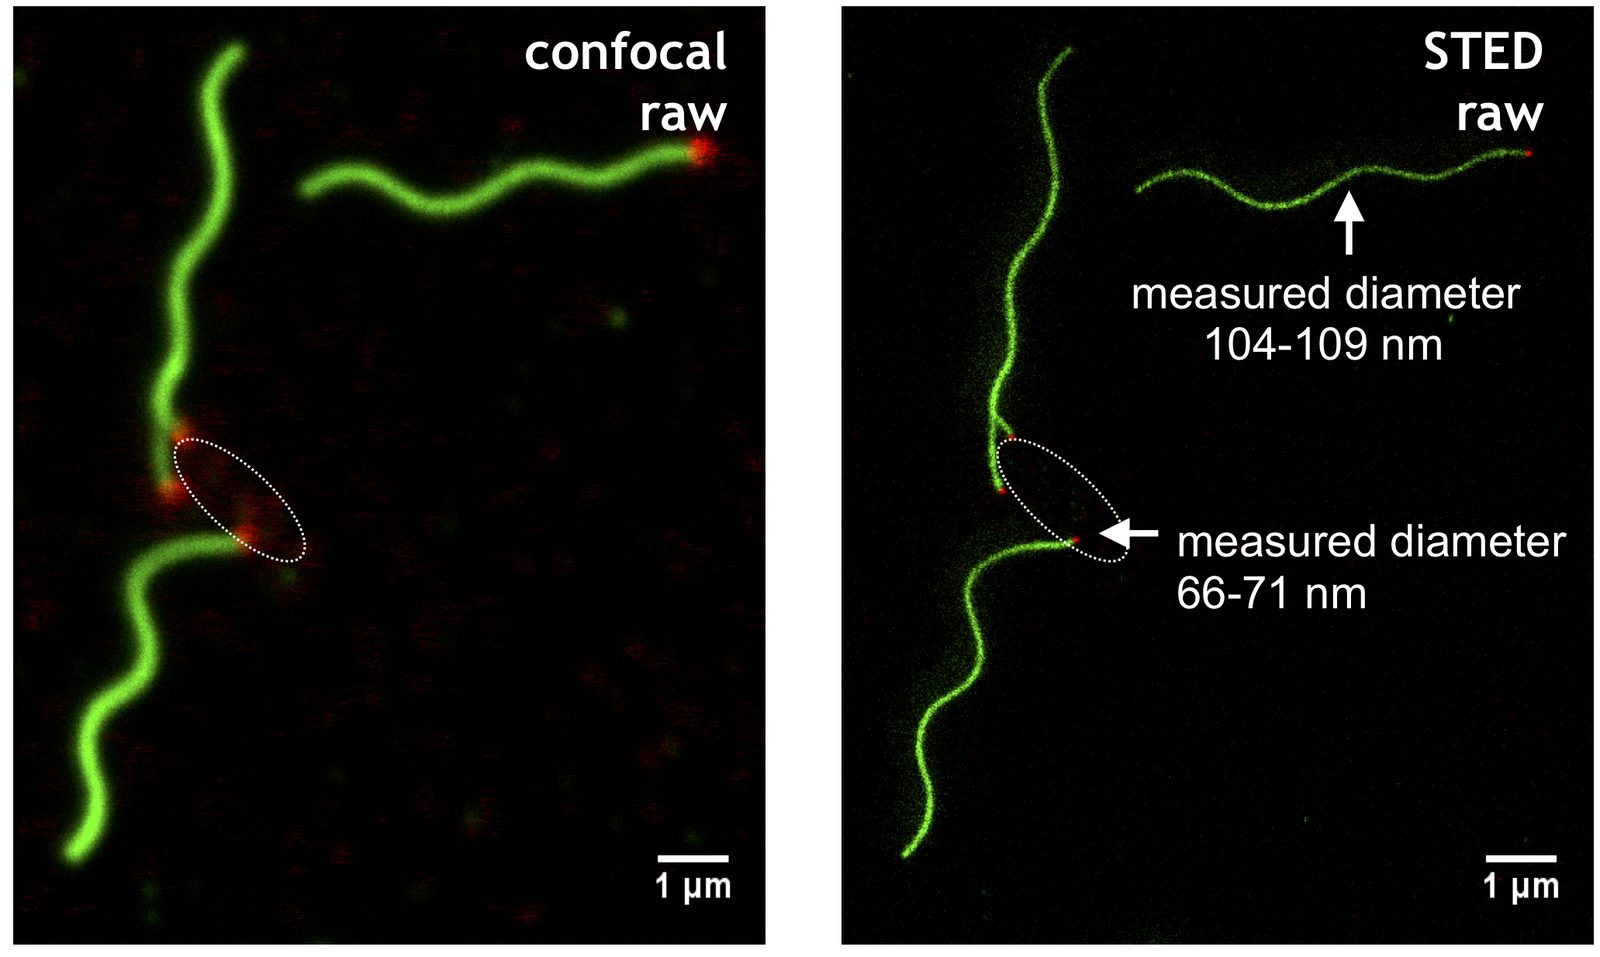
We image flagella, secretion systems and single proteins in living bacteria with widefield, confocal, TIRF, SIM and STED microscopy. Maleimide dyes label the flagellar filaments of living cells; HaloTag and SNAP-tag fusions make single proteins visible and let us track them.
Software
Single-cell experiments generate large time-lapse data sets. We develop and apply software for automated segmentation, tracking and quantification of bacteria, for example with ilastik, Omnipose and DeLTA, and release our pipelines as open source.
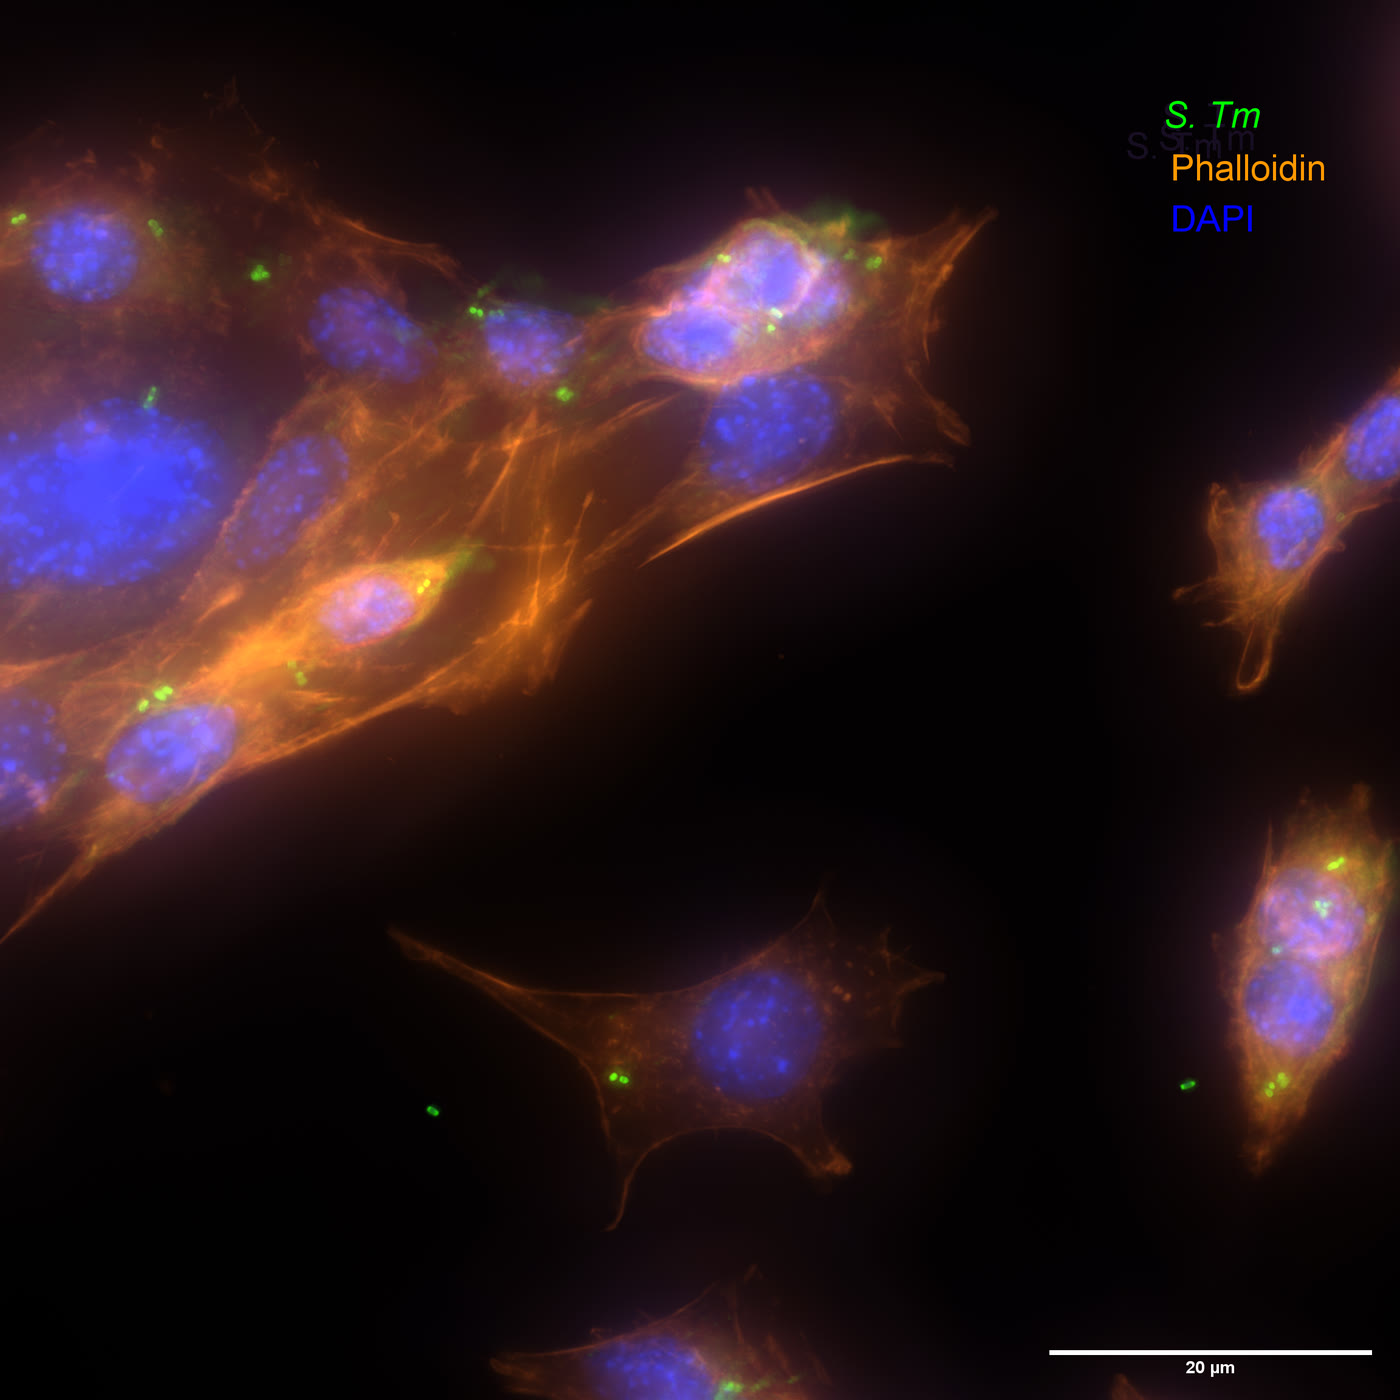
We infect cultured human and murine cell lines, for example HeLa cells and intestinal epithelial cells, and measure adhesion, invasion and intracellular growth of Salmonella. Lattice light-sheet and live-cell microscopy with labelled flagella show what happens to the flagella during invasion and inside the host cell, and reporter cell lines show when the Salmonella-containing vacuole is damaged.
Together with collaborators, we use mouse infection models.
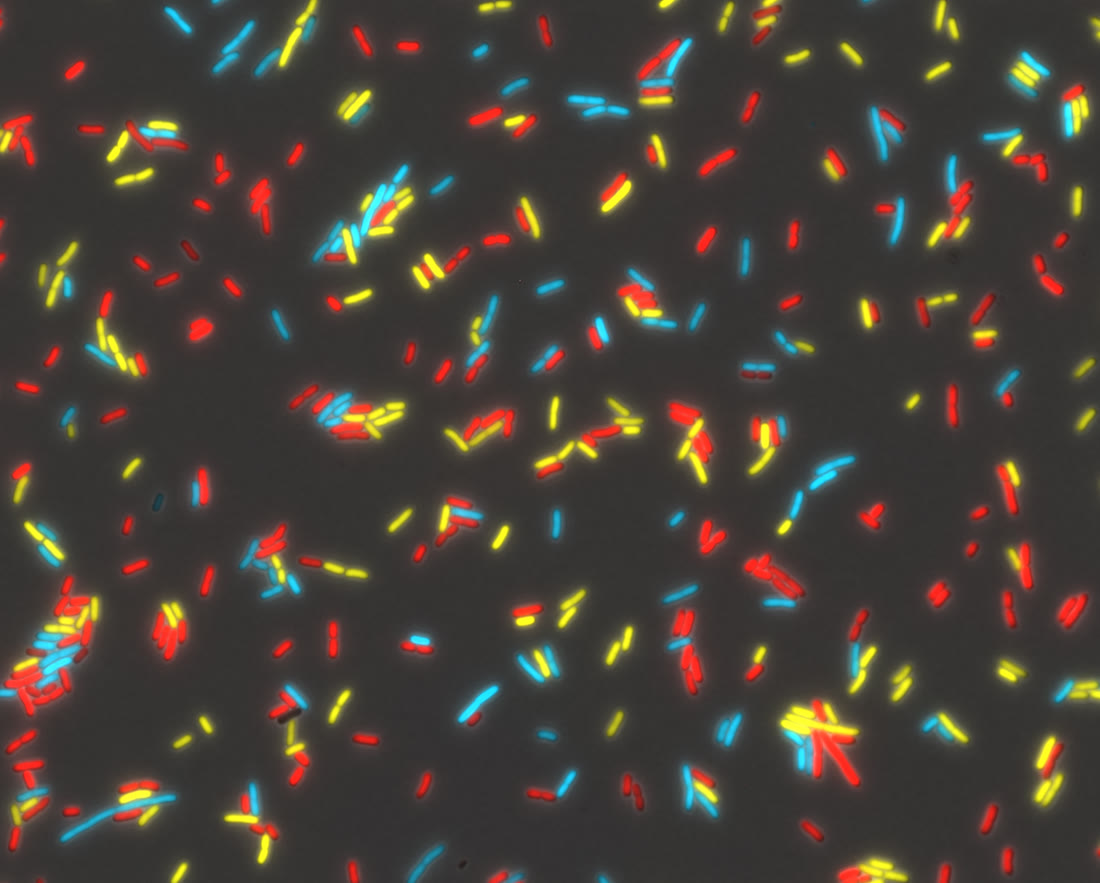
We engineer the chromosome of Salmonella and other bacteria: deletions, point mutations, inducible promoters, fluorescent reporters and protein fusions. Reporter strains make gene expression, protein export or plasmid transfer visible in single cells.
Image: Bacteria that express different fluorescent proteins.
We purify components of the flagellum and of the secretion systems and characterise them biochemically. Secretion assays measure how fast and in which order the type-III secretion system exports its substrates; engineered strains export recombinant proteins into the culture medium.
Image: Animation: flagellin assembles at the tip of the growing filament.
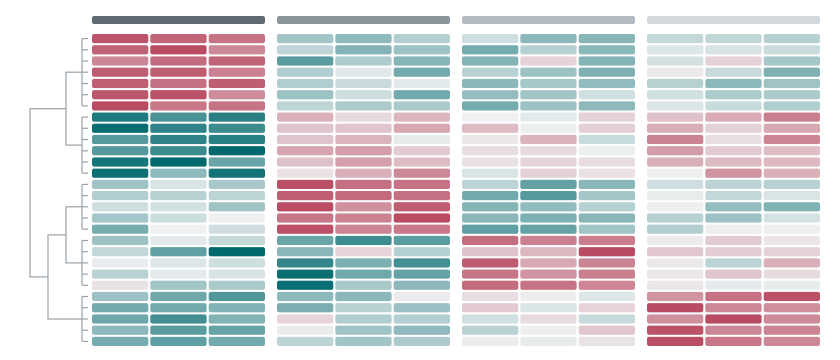
We use RNA sequencing to measure how bacteria adjust their gene expression to the environment, for example in culture, during infection and during phage infection. Transcriptome data, target prediction and reporter assays help us to identify regulators such as small regulatory RNAs.
Image: Schematic heatmap of gene expression (z-scores, clustered); an illustration, not measured data.
With collaborators, we determine structures of flagellar components by cryo-EM and, with the Ghosal group, by cryo-electron tomography. Biophysical models describe filament growth, protein export and the costs and benefits of motility.
Image: Density map of the FliD cap on the filament (top view).